Funções logarítmicas

Nesta página você descobrirá o que são funções logarítmicas e também como representá-las em um gráfico. Além disso, você verá todas as suas características, como calcular seu domínio e diversos exemplos para melhor entendê-lo. Por fim, você poderá praticar exercícios e problemas resolvidos passo a passo sobre funções logarítmicas.

O que é uma função logarítmica?

A definição de uma função logarítmica é a seguinte:

Em matemática, funções logarítmicas são funções cuja variável independente x faz parte do argumento de um logaritmo. Em outras palavras, eles são os seguintes:

f(x)=\log_a x

Ouro

a

É necessariamente um número real positivo e diferente de 1.

Por exemplo, a seguinte função é logarítmica:

f(x)=\log_5 x

Antes de discutir as características das funções logarítmicas, vamos revisar brevemente o conceito de logaritmo:

  • O logaritmo básico

    a

    de

    y

    é o elemento ao qual o número deve ser elevado

    a

    para que o resultado seja o número

    y.

\log_a y = x \iff a^x = y

Lembremos também que o logaritmo natural (ou logaritmo natural) equivale ao logaritmo cuja base é o número exponencial e:

\ln x = \log_e x

Em contraste, a base geralmente é omitida quando é 10. Esses tipos de logaritmos são chamados de logaritmos decimais ou algoritmos comuns:

\log_{10} x = \log x

Domínio de uma função logarítmica

Um logaritmo admite apenas números positivos, portanto o domínio de uma função logarítmica serão todos os números que satisfaçam esta condição.

Como exemplo, calcularemos o domínio da seguinte função logarítmica:

f(x)=\log_3 (2x-4)

O argumento de um logaritmo deve ser maior que 0, porque não existem logaritmos de números negativos nem logaritmos de 0. Devemos, portanto, observar quando o argumento da função é maior que zero:

2x-4>0″ title=”Rendered by QuickLaTeX.com” height=”14″ width=”82″ style=”vertical-align: -2px;”></p>
</p>
<p> Agora resolvemos a desigualdade: </p>
</p>
<p class=2x>4″ title=”Rendered by QuickLaTeX.com” height=”14″ width=”52″ style=”vertical-align: -2px;”></p>
</p>
<p class=x>\cfrac{4}{2}” title=”Rendered by QuickLaTeX.com” height=”38″ width=”45″ style=”vertical-align: -12px;”></p>
</p>
<p class=x>2″ title=”Rendered by QuickLaTeX.com” height=”14″ width=”42″ style=”vertical-align: -2px;”></p>
</p>
<p> Portanto, o argumento do logaritmo será maior que zero se</p>
</p>
<p class=x

é maior que 2. Assim, o domínio da função consiste em todos os números maiores que 2 (não incluídos):

\text{Dom } f = (2,+\infty)

Características das funções logarítmicas

  • Como vimos, o domínio de uma função logarítmica consiste em todos os x que tornam o argumento do logaritmo positivo.
  • O intervalo ou intervalo de uma função logarítmica são todos números reais.

\text{Im } f= \mathbb{R}

  • Cada função logarítmica é uma função contínua e injetiva.
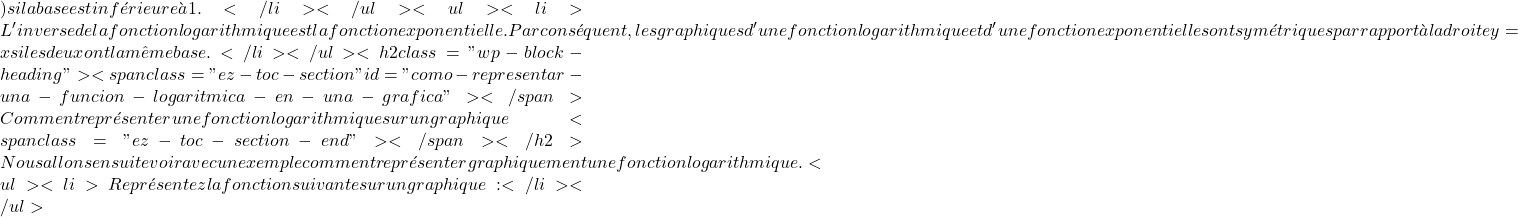
  • O crescimento ou diminuição de uma função logarítmica depende da base do logaritmo: se a base for maior que 1

    (a>1)” title=”Rendered by QuickLaTeX.com” height=”19″ width=”54″ style=”vertical-align: -5px;”></p>
<p> Porém, a função é crescente se a base estiver no intervalo entre zero e um.</p>
<p class=(0 la fonction est décroissante.</li>
</ul>
<ul>
<li> De même, la courbure de toute fonction logarithmique est également définie par sa base : la fonction sera concave (en forme” title=”Rendered by QuickLaTeX.com” height=”63″ width=”653″ style=”vertical-align: -5px;”></p>
<p> \bm{\cap}</p>
<p class=) si la base est supérieure à 1, en revanche, elle sera convexe (sous forme de

    \bm{\xícara}

    ) si la base est inférieure à 1.</li>
</ul>
<ul>
<li> L’inverse de la fonction logarithmique est la fonction exponentielle. Par conséquent, les graphiques d’une fonction logarithmique et d’une fonction exponentielle sont symétriques par rapport à la droite y=x si les deux ont la même base. </li>
</ul>
<h2 class="wp-block-heading"><span class="ez-toc-section" id="como-representar-una-funcion-logaritmica-en-una-grafica"></span> Comment représenter une fonction logarithmique sur un graphique<span class="ez-toc-section-end"></span></h2>
<p> Nous allons ensuite voir avec un exemple comment représenter graphiquement une fonction logarithmique.</p>
<ul>
<li> Représentez la fonction suivante sur un graphique :</li>
</ul>
<p>” title=”Rendered by QuickLaTeX.com” height=”217″ width=”1518″ style=”vertical-align: -5px;”></p>
<p> f(x)=\log_2 (x-1)</p>
<p class= La première chose à faire est de trouver le domaine de la fonction. Et comme c'est un logarithme, son argument doit être supérieur à 0, puisqu'il n'existe ni logarithmes de nombres négatifs ni logarithme de 0. On regarde donc quand l'argument de

    \log_2 (x-1)

    est supérieur à 0 :

    x-1>0x>1

     Par conséquent, l'argument du logarithme sera positif si et seulement si

    x

    est supérieur à 1. Le domaine de la fonction est donc composé de tous les nombres supérieurs à 1 (non inclus) :

    \text{Dom } f = (1,+\infty)

     Une fois que nous connaissons le domaine de la fonction logarithmique, nous créons un tableau de valeurs. Évidemment, plus il y a de points calculés, plus la représentation de la fonction sera précise. Mais calculer environ 5 points dans l'intervalle du domaine suffit : 

<div class="wp-block-columns is-layout-flex wp-container-171">
<div class="wp-block-column is-layout-flow" style="flex-basis:66.66%">
<ul>
<li>” title=”Rendered by QuickLaTeX.com” height=”83″ width=”1969″ style=”vertical-align: 0px;”></p>
<p> x= 1,5 \ seta longa à direita \ f(1,5)=\log_2 (1,5-1)=-1</p>
<p class=</li>
</ul>
<ul>
<li>” title=”Rendered by QuickLaTeX.com” height=”19″ width=”221″ style=”vertical-align: -5px;”></p>
<p> x= 2 \ seta longa à direita \ f(2)=\log_2 (2-1)= 0</p>
<p class=</li>
</ul>
<ul>
<li>” title=”Rendered by QuickLaTeX.com” height=”19″ width=”221″ style=”vertical-align: -5px;”></p>
<p> x= 3 \ seta longa \ f(3)=\log_2 (3-1) = 1</p>
<p class=</li>
</ul>
<ul>
<li>” title=”Rendered by QuickLaTeX.com” height=”19″ width=”221″ style=”vertical-align: -5px;”></p>
<p> x= 5 \ seta longa à direita \ f(5)=\log_2 (5-1) = 2</p>
<p class=</li>
</ul>
<ul>
<li>” title=”Rendered by QuickLaTeX.com” height=”19″ width=”221″ style=”vertical-align: -5px;”></p>
<p> x= 9 \ seta longa à direita \ f(9)=\log_2 (9-1) = 3</p>
<p class=</li>
</ul>
</div>
<div class="wp-block-column is-vertically-aligned-center is-layout-flow" style="flex-basis:33.33%">” title=”Rendered by QuickLaTeX.com” height=”40″ width=”582″ style=”vertical-align: -4px;”></p>
<p> \begin{array}{c|c} x & f(x) \\ \hline 1,5 & -1 \\ 2 & 0 \\ 3 & 1 \\ 5 & 2 \\ 9 & 3 \end{array }</p>
<p class=</div>
</div>
<p> Nous vous recommandons d’utiliser une calculatrice pour trouver les points dans le tableau des valeurs, car ils ne sont pas faciles à calculer à la main. Cependant, dans certaines calculatrices, seuls les logarithmes en base 10 peuvent être calculés, auquel cas n’oubliez pas que vous pouvez trouver le résultat de n’importe quel logarithme en appliquant le changement de propriété de base des logarithmes :” title=”Rendered by QuickLaTeX.com” height=”19″ width=”3068″ style=”vertical-align: -5px;”></p>
<p> \log_2 0,5 = \cfrac{ \log 0,5 }{ \log 2} = -1</p>
<p class= Nous représentons maintenant les points obtenus sur un graphique <strong>:</strong> </p>
<div class="wp-block-image">
<figure class="aligncenter size-large is-resized"><img decoding="async" loading="lazy" src="http://mathority.org/wp-content/uploads/2023/07/comment-representer-ou-graphiquer-une-fonction-logarithmique.webp" alt="" class="wp-image-258" width="370" height="337" srcset="" sizes="" data-src=""></figure>
</div>
<p> Et enfin, nous joignons les points et allongeons la fonction : </p>
<div class="wp-block-image">
<figure class="aligncenter size-large is-resized"><img decoding="async" loading="lazy" src="http://mathority.org/wp-content/uploads/2023/07/exemple-de-representation-graphique-d-une-fonction-logarithmique.webp" alt="exemple de représentation graphique d'une fonction logarithmique" class="wp-image-259" width="370" height="339" srcset="" sizes="" data-src=""></figure>
</div>
<p> Notez que la fonction de droite continue de croître jusqu’à l’infini. En revanche, la fonction de gauche diminue mais n’atteint jamais x=1. Même s’il s’en rapproche beaucoup, il ne le touche jamais. Cela signifie que la droite x=1 est une asymptote verticale de la fonction. </p>
<h2 class="wp-block-heading"><span class="ez-toc-section" id="ejercicios-resueltos-de-funciones-logaritmica"></span> Exercices résolus sur les fonctions logarithmiques<span class="ez-toc-section-end"></span></h2>
<h3 class="wp-block-heading"> Exercice 1</h3>
<p> Calculez le domaine de la fonction logarithmique suivante : ” title=”Rendered by QuickLaTeX.com” height=”347″ width=”4961″ style=”vertical-align: -5px;”></p>
<p> f(x)= \log_8 4x</p>
<p class=

<div class="wp-block-otfm-box-spoiler-start otfm-sp__wrapper otfm-sp__box js-otfm-sp-box__closed otfm-sp__E6F9EF" role="button" tabindex="0" aria-expanded="false" data-otfm-spc="#E6F9EF" style="text-align:center">
<div class="otfm-sp__title"> <strong>Voir la solution</strong></div>
</div>
<p> Il n’existe ni le logarithme d’un nombre négatif ni le logarithme de 0. Il faut donc regarder quand l’argument du logarithme est supérieur à 0 : ” title=”Rendered by QuickLaTeX.com” height=”54″ width=”2128″ style=”vertical-align: -20px;”></p>
<p> 4x>0 x>\cfrac{0}{4} x>0 \mathbf{Dom } \ \bm{f = (0,+\infty)}</p>
<p class=

<div class="wp-block-otfm-box-spoiler-end otfm-sp_end"></div>
<h3 class="wp-block-heading"> Exercice 2</h3>
<p> Trouvez le domaine de la fonction logarithmique suivante : ” title=”Rendered by QuickLaTeX.com” height=”60″ width=”582″ style=”vertical-align: -4px;”></p>
<p> f(x)= log(4-x)</p>
<p class=

<div class="wp-block-otfm-box-spoiler-start otfm-sp__wrapper otfm-sp__box js-otfm-sp-box__closed otfm-sp__E6F9EF" role="button" tabindex="0" aria-expanded="false" data-otfm-spc="#E6F9EF" style="text-align:center">
<div class="otfm-sp__title"> <strong>Voir la solution</strong></div>
</div>
<p> Il n’existe ni le logarithme d’un nombre négatif ni le logarithme de 0. Il faut donc regarder quand l’argument du logarithme est supérieur à zéro : ” title=”Rendered by QuickLaTeX.com” height=”54″ width=”2145″ style=”vertical-align: -20px;”></p>
<p> 4-x>0-x>-4x<\cfrac{-4}{-1} = 4</p>
<p class= N'oubliez pas que si dans une inégalité nous changeons les côtés d'un nombre négatif qui se multiplie ou se divise, nous devons également faire pivoter le signe de l'inégalité.

    x<4 \mathbf{Dom } \ \bm{f = (-\infty,4)}


<div class="wp-block-otfm-box-spoiler-end otfm-sp_end"></div>
<h3 class="wp-block-heading"> Exercice 3</h3>
<p> Représentez la fonction logarithmique suivante sur un graphique : ” title=”Rendered by QuickLaTeX.com” height=”60″ width=”582″ style=”vertical-align: -4px;”></p>
<p> f(x)= \log_2 x</p>
<p class=

<div class="wp-block-otfm-box-spoiler-start otfm-sp__wrapper otfm-sp__box js-otfm-sp-box__closed otfm-sp__E6F9EF" role="button" tabindex="0" aria-expanded="false" data-otfm-spc="#E6F9EF" style="text-align:center">
<div class="otfm-sp__title"> <strong>Voir la solution</strong></div>
</div>
<p> Tout d’abord, il faut calculer le domaine de la fonction logarithmique : ” title=”Rendered by QuickLaTeX.com” height=”54″ width=”1771″ style=”vertical-align: -20px;”></p>
<p> x>0 \text{Dom } f = (0,+\infty)</p>
<p class= Nous créons maintenant un tableau de valeurs en donnant des valeurs à <em>x</em> dans l’intervalle du domaine : </p>
<div class="wp-block-columns is-layout-flex wp-container-174">
<div class="wp-block-column is-layout-flow" style="flex-basis:66.66%">” title=”Rendered by QuickLaTeX.com” height=”82″ width=”582″ style=”vertical-align: -4px;”></p>
<p> x= 0,5 \ \longrightarrow \ f(0,5)= \log_2 0,5= -1 x= 1 \ \longrightarrow \ f(1)= \log_2 1= 0 x= 2 \ \longrightarrow \ f( 2)= \log_2 2 = 1 x= 4 \ \longrightarrow \ f(4)= \log_2 4= 2 x= 8 \ \longrightarrow \ f(8)= \log_2 8= 3</p>
<p class=</div>
<div class="wp-block-column is-vertically-aligned-center is-layout-flow" style="flex-basis:33.33%">” title=”Rendered by QuickLaTeX.com” height=”40″ width=”582″ style=”vertical-align: -4px;”></p>
<p> \begin{array}{c|c} x & f(x) \\ \hline 0,5 & -1 \\ 1 & 0 \\ 2 & 1 \\ 4 & 2 \\ 8 & 3 \end{array }</p>
<p class=</div>
</div>
<p> Enfin, nous représentons les points sur le graphique et dessinons la fonction : </p>
<div class="wp-block-image">
<figure class="aligncenter size-large is-resized"><img decoding="async" loading="lazy" src="http://mathority.org/wp-content/uploads/2023/07/polynomes-p-icone.png" alt="exercices résolus de fonctions logarithmiques" class="wp-image-260" width="375" height="313" srcset="" sizes="" data-src=""></figure>
</div>
<p> Notez que la fonction de droite continue de croître jusqu’à l’infini. Par contre, à gauche la fonction diminue mais ne croise jamais x=0. C’est parce que la fonction a une asymptote verticale sur l’axe Y. </p>
<div class="wp-block-otfm-box-spoiler-end otfm-sp_end"></div>
<h3 class="wp-block-heading"> Exercice 4</h3>
<p> Représentez graphiquement la fonction logarithmique suivante : ” title=”Rendered by QuickLaTeX.com” height=”173″ width=”3070″ style=”vertical-align: -5px;”></p>
<p> f(x)= \log_2 (x+2)</p>
<p class=

<div class="wp-block-otfm-box-spoiler-start otfm-sp__wrapper otfm-sp__box js-otfm-sp-box__closed otfm-sp__E6F9EF" role="button" tabindex="0" aria-expanded="false" data-otfm-spc="#E6F9EF" style="text-align:center">
<div class="otfm-sp__title"> <strong>Voir la solution</strong></div>
</div>
<p> La première chose à faire est de calculer le domaine de la fonction logarithmique : ” title=”Rendered by QuickLaTeX.com” height=”53″ width=”1825″ style=”vertical-align: -19px;”></p>
<p> x+2>0 x>-2 \text{Dom } f = (-2,+\infty)</p>
<p class= Nous créons maintenant une table de valeurs donnant des valeurs à <em>x</em> dans l’intervalle de domaine : </p>
<div class="wp-block-columns is-layout-flex wp-container-177">
<div class="wp-block-column is-layout-flow" style="flex-basis:66.66%">” title=”Rendered by QuickLaTeX.com” height=”82″ width=”582″ style=”vertical-align: -4px;”></p>
<p> x= -1,5 \ \longrightarrow \ f(-1,5)= \log_2 (-1,5+2)= -1 x= -1 \ \longrightarrow \ f(-1)= \log_2 (-1 +2)=0 x = 0 \ \longrightarrow \ f(0)=\log_2 (0+2)=1 x= 2 \ \longrightarrow \ f(2)=\log_2 (2+2)=2 x= 6 \ \longrightarrow \ f( 6)=\log_2 (6+2)=3</p>
<p class=</div>
<div class="wp-block-column is-vertically-aligned-center is-layout-flow" style="flex-basis:33.33%">” title=”Rendered by QuickLaTeX.com” height=”40″ width=”582″ style=”vertical-align: -4px;”></p>
<p> \begin{array}{c|c} x & f(x) \\ \hline -1.5 & -1 \\ -1 & 0 \\ 0 & 1 \\ 2 & 2 \\ 6 & 3 \end {array }</p>
<p class=</div>
</div>
<p> Enfin, nous traçons les points sur le graphique et traçons la fonction : </p>
<div class="wp-block-image">
<figure class="aligncenter size-large is-resized"><img decoding="async" loading="lazy" src="http://mathority.org/wp-content/uploads/2023/07/cropped-polynomials-p-icon.png.png" alt="exercice résolu étape par étape de la fonction logarithmique" class="wp-image-261" width="356" height="322" srcset="" sizes="" data-src=""></figure>
</div>
<p> Notez que la fonction de droite continue de croître jusqu’à l’infini. Par contre, à gauche la fonction diminue mais ne croise jamais x=-2. C’est parce qu’il a une asymptote verticale à x=-2. </p>
<div class="wp-block-otfm-box-spoiler-end otfm-sp_end"></div>
<h3 class="wp-block-heading"> Exercice 5</h3>
<p> Faites la représentation graphique de la fonction logarithmique suivante : ” title=”Rendered by QuickLaTeX.com” height=”195″ width=”3059″ style=”vertical-align: -5px;”></p>
<p> f(x)=\log_3x</p>
<p class=

<div class="wp-block-otfm-box-spoiler-start otfm-sp__wrapper otfm-sp__box js-otfm-sp-box__closed otfm-sp__E6F9EF" role="button" tabindex="0" aria-expanded="false" data-otfm-spc="#E6F9EF" style="text-align:center">
<div class="otfm-sp__title"> <strong>Voir la solution</strong></div>
</div>
<p> La première chose à faire est de calculer le domaine de la fonction logarithmique : ” title=”Rendered by QuickLaTeX.com” height=”53″ width=”1825″ style=”vertical-align: -19px;”></p>
<p> x>0 \text{Dom } f = (0,+\infty)</p>
<p class= Nous créons maintenant un tableau de valeurs évaluant la fonction à différents points de l'intervalle de domaine : 

<div class="wp-block-columns is-layout-flex wp-container-180">
<div class="wp-block-column is-layout-flow" style="flex-basis:66.66%">” title=”Rendered by QuickLaTeX.com” height=”80″ width=”855″ style=”vertical-align: 0px;”></p>
<p> x= 1 \ \longrightarrow \ f (1)= \log_3 1= 0 x= 3 \ \longrightarrow \ f(3)= \log_3 3= 1 x= 9 \ \longrightarrow \ f(9)= \log_3 9= 2 \displaystyle x= \cfrac{1}{3} \ \longrightarrow \ f\left( \frac{1}{3} \right)= \log_3 \frac{1}{3}= -1 \displaystyle x= \cfrac{1}{9} \ \longrightarrow \ f\left( \frac{1}{9} \right)= \log_3 \frac{1}{9}= -2</p>
<p class=</div>
<div class="wp-block-column is-vertically-aligned-center is-layout-flow" style="flex-basis:33.33%">” title=”Rendered by QuickLaTeX.com” height=”40″ width=”582″ style=”vertical-align: -4px;”></p>
<p> \begin{array}{c|c} x & f(x) \\ \hline 1 & 0 \\ 3 & 1 \\ 9 & 2 \\ \frac{1}{3} & -1 \\[1.1 ex] \frac{1}{9} & -2 \end{array}</p>
<p class=</div>
</div>
<p> Et pour finir, nous représentons les points sur le graphique et peignons la fonction : </p>
<div class="wp-block-image">
<figure class="aligncenter size-large is-resized"><img decoding="async" loading="lazy" src="http://mathority.org/wp-content/uploads/2023/07/exemples-de-fonctions-logarithmiques-ou-avec-logarithmes.webp" alt="exemples de fonctions logarithmiques ou avec logarithmes" class="wp-image-262" width="438" height="321" srcset="" sizes="" data-src=""></figure>
</div>
<p> Notez que la fonction de droite continue de croître jusqu’à l’infini. Mais à gauche la fonction décroît bien qu’elle ne croise jamais x=0. C’est parce que la fonction a une asymptote verticale sur l’axe des ordonnées. </p>
<div class="wp-block-otfm-box-spoiler-end otfm-sp_end"></div>
<h3 class="wp-block-heading"> Exercice 6</h3>
<p> Représentez graphiquement la fonction suivante avec un logarithme : ” title=”Rendered by QuickLaTeX.com” height=”195″ width=”3181″ style=”vertical-align: -5px;”></p>
<p> f(x)= \log_2(1-x)</p>
<p class=

<div class="wp-block-otfm-box-spoiler-start otfm-sp__wrapper otfm-sp__box js-otfm-sp-box__closed otfm-sp__E6F9EF" role="button" tabindex="0" aria-expanded="false" data-otfm-spc="#E6F9EF" style="text-align:center">
<div class="otfm-sp__title"> <strong>Voir la solution</strong></div>
</div>
<p> Avant de représenter graphiquement la fonction, il faut calculer son domaine : ” title=”Rendered by QuickLaTeX.com” height=”53″ width=”1817″ style=”vertical-align: -19px;”></p>
<p> 1-x>0-x>-1x<\cfrac{-1}{-1} = 1</p>
<p class= N'oubliez pas que si dans une inégalité nous changeons les côtés d'un nombre négatif qui multiplie ou divise, nous devons également inverser le signe de l'inégalité.

    x<1 \text{Dom } f = (-\infty,1)

     Nous créons maintenant une table de valeurs donnant des valeurs à <em>x</em> dans l’intervalle de domaine : </p>
<div class="wp-block-columns is-layout-flex wp-container-183">
<div class="wp-block-column is-layout-flow" style="flex-basis:66.66%">” title=”Rendered by QuickLaTeX.com” height=”82″ width=”582″ style=”vertical-align: -4px;”></p>
<p> x= 0,5 \ \longrightarrow \ f(0,5)= \log_2 (1-0,5)=-1 x= 0 \ \longrightarrow \ f(0)= \log_2 (1-0)= 0 x = -1 \ \longrightarrow \ f(-1)=\log_2 (1-(-1))=1 x= -3 \ \longrightarrow \ f(-3)=\log_2 (1-(-3))= 2 x= -7 \ \longrightarrow\f(-7)=\log_2 (1-(-7))=3</p>
<p class=</div>
<div class="wp-block-column is-vertically-aligned-center is-layout-flow" style="flex-basis:33.33%">” title=”Rendered by QuickLaTeX.com” height=”40″ width=”582″ style=”vertical-align: -4px;”></p>
<p> \begin{array}{c|c} x & f(x) \\ \hline 0,5 & -1 \\ 0 & 0 \\ -1 & 1 \\ -3 & 2 \\ -7 & 3 \ end{ variedade}</p>
<p class=</div>
</div>
<p> Et pour finir, nous représentons les points sur le graphique et traçons la fonction : </p>
<div class="wp-block-image">
<figure class="aligncenter size-large is-resized"><img decoding="async" loading="lazy" src="http://mathority.org/wp-content/uploads/2023/07/domaine-de-fonction-logarithmique.webp" alt="fonction de domaine logarithmique" class="wp-image-263" width="395" height="284" srcset="" sizes="" data-src=""></figure>
</div>
<p> Notez que la fonction de gauche continue de croître jusqu’à l’infini. Par contre, à droite la fonction diminue mais ne croise jamais x=1. Par conséquent, il a une asymptote verticale sur la droite x=1. </p>
<div class="wp-block-otfm-box-spoiler-end otfm-sp_end"></div>
<h2 class="wp-block-heading"><span class="ez-toc-section" id="propiedades-de-los-logaritmos"></span>Propriétés des logarithmes<span class="ez-toc-section-end"></span></h2>
<p> À titre récapitulatif, vous trouverez ci-dessous les propriétés des logarithmes au cas où vous auriez besoin d’effectuer des opérations avec des fonctions logarithmiques :</p>
<ul>
<li> Le logarithme d’un produit équivaut à la somme des logarithmes des facteurs.</li>
</ul>
<p>” title=”Rendered by QuickLaTeX.com” height=”195″ width=”5919″ style=”vertical-align: -5px;”></p>
<p> \log(A\cdot B) = \log A + \log B</p>
<p class=

<ul>
<li> Le logarithme d’un quotient est égal à la différence du logarithme du dividende moins le logarithme du diviseur.</li>
</ul>
<p>” title=”Rendered by QuickLaTeX.com” height=”41″ width=”943″ style=”vertical-align: -5px;”></p>
<p> \displaystyle \log \left(\frac{A}{B} \right) = \log A – \log B</p>
<p class=

<ul>
<li> Le logarithme d’une puissance revient à multiplier l’exposant de la puissance par le logarithme de la base.</li>
</ul>
<p>” title=”Rendered by QuickLaTeX.com” height=”41″ width=”892″ style=”vertical-align: -5px;”></p>
<p> \ displaystyle \ log A ^ n = n \ cdot \ log A</p>
<p class=

<ul>
<li> Le logarithme d’une racine équivaut à diviser le logarithme du radind par l’indice de la racine.</li>
</ul>
<p>” title=”Rendered by QuickLaTeX.com” height=”41″ width=”807″ style=”vertical-align: -5px;”></p>
<p> \displaystyle \log \sqrt[n]{A} =\cfrac{\log A}{n} $</li>
</ul>


			</div><!-- .entry-content .clear -->
</div>

	
</article><!-- #post-## -->


	        <nav class= Navegação de Post

    Deixe um comentário

    O seu endereço de e-mail não será publicado. Campos obrigatórios são marcados com *

Rolar para cima