Logarithmische funktionen

Auf dieser Seite erfahren Sie, was logarithmische Funktionen sind und wie man sie in einem Diagramm darstellt. Darüber hinaus sehen Sie alle seine Eigenschaften, wie man seine Domäne berechnet und mehrere Beispiele, um es besser zu verstehen. Abschließend können Sie mit Schritt für Schritt gelösten Übungen und Problemen zu logarithmischen Funktionen üben.

Was ist eine logarithmische Funktion?

Die Definition einer logarithmischen Funktion lautet wie folgt:

Logarithmische Funktionen sind in der Mathematik Funktionen, deren unabhängige Variable x Teil des Arguments eines Logarithmus ist. Mit anderen Worten lauten sie wie folgt:

f(x)=\log_a x

Gold

a

Es ist notwendigerweise eine positive reelle Zahl und ungleich 1.

Die folgende Funktion ist beispielsweise logarithmisch:

f(x)=\log_5 x

Bevor wir die Eigenschaften logarithmischer Funktionen diskutieren, werfen wir einen kurzen Blick auf das Konzept des Logarithmus:

  • Der grundlegende Logarithmus

    a

    von

    y

    ist das Element, auf das die Zahl erhöht werden soll

    a

    so dass das Ergebnis die Zahl ist

    y.

\log_a y = x \iff a^x = y

Erinnern wir uns auch daran, dass der natürliche Logarithmus (oder natürlicher Logarithmus) dem Logarithmus entspricht, dessen Basis die Exponentialzahl e ist:

\ln x = \log_e x

Im Gegensatz dazu wird die Basis normalerweise weggelassen, wenn sie 10 beträgt. Diese Arten von Logarithmen werden als dezimale Logarithmen oder allgemeine Algorithmen bezeichnet:

\log_{10} x = \log x

Bereich einer logarithmischen Funktion

Ein Logarithmus lässt nur positive Zahlen zu, daher umfasst der Definitionsbereich einer logarithmischen Funktion alle Zahlen, die diese Bedingung erfüllen.

Als Beispiel berechnen wir den Definitionsbereich der folgenden logarithmischen Funktion:

f(x)=\log_3 (2x-4)

Das Argument eines Logarithmus muss größer als 0 sein, da es weder Logarithmen negativer Zahlen noch Logarithmen von 0 gibt. Wir müssen uns daher ansehen, wann das Argument der Funktion größer als Null ist:

2x-4>0″ title=“Rendered by QuickLaTeX.com“ height=“14″ width=“82″ style=“vertical-align: -2px;“></p>
</p>
<p> Jetzt lösen wir die Ungleichung: </p>
</p>
<p class=2x>4″ title=“Rendered by QuickLaTeX.com“ height=“14″ width=“52″ style=“vertical-align: -2px;“></p>
</p>
<p class=x>\cfrac{4}{2}“ title=“Rendered by QuickLaTeX.com“ height=“38″ width=“45″ style=“vertical-align: -12px;“></p>
</p>
<p class=x>2″ title=“Rendered by QuickLaTeX.com“ height=“14″ width=“42″ style=“vertical-align: -2px;“></p>
</p>
<p> Das Argument des Logarithmus ist also größer als Null, wenn</p>
</p>
<p class=x

ist größer als 2. Somit besteht der Definitionsbereich der Funktion aus allen Zahlen größer als 2 (nicht enthalten):

\text{Dom } f = (2,+\infty)

Eigenschaften logarithmischer Funktionen

  • Wie wir gesehen haben, besteht der Definitionsbereich einer logarithmischen Funktion aus allen x, die das Argument des Logarithmus positiv machen.
  • Der Bereich oder Bereich einer logarithmischen Funktion sind alle reellen Zahlen.

\text{Im } f= \mathbb{R}

  • Jede logarithmische Funktion ist eine stetige und injektive Funktion.
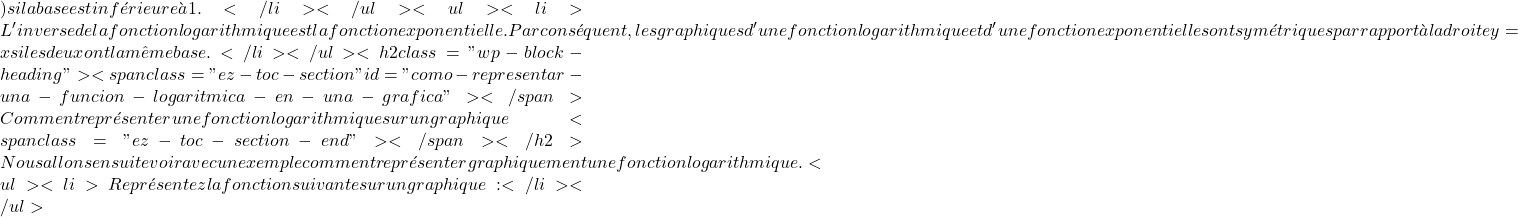
  • Die Zunahme oder Abnahme einer logarithmischen Funktion hängt von der Basis des Logarithmus ab: wenn die Basis größer als 1 ist

    (a>1)“ title=“Rendered by QuickLaTeX.com“ height=“19″ width=“54″ style=“vertical-align: -5px;“></p>
<p> Die Funktion steigt jedoch, wenn die Basis im Intervall zwischen Null und Eins liegt.</p>
<p class=(0 la fonction est décroissante.</li>
</ul>
<ul>
<li> De même, la courbure de toute fonction logarithmique est également définie par sa base : la fonction sera concave (en forme“ title=“Rendered by QuickLaTeX.com“ height=“63″ width=“653″ style=“vertical-align: -5px;“></p>
<p> \bm{\cap}</p>
<p class=) si la base est supérieure à 1, en revanche, elle sera convexe (sous forme de

    \bm{\cup}

    ) si la base est inférieure à 1.</li>
</ul>
<ul>
<li> L’inverse de la fonction logarithmique est la fonction exponentielle. Par conséquent, les graphiques d’une fonction logarithmique et d’une fonction exponentielle sont symétriques par rapport à la droite y=x si les deux ont la même base. </li>
</ul>
<h2 class="wp-block-heading"><span class="ez-toc-section" id="como-representar-una-funcion-logaritmica-en-una-grafica"></span> Comment représenter une fonction logarithmique sur un graphique<span class="ez-toc-section-end"></span></h2>
<p> Nous allons ensuite voir avec un exemple comment représenter graphiquement une fonction logarithmique.</p>
<ul>
<li> Représentez la fonction suivante sur un graphique :</li>
</ul>
<p>“ title=“Rendered by QuickLaTeX.com“ height=“217″ width=“1518″ style=“vertical-align: -5px;“></p>
<p> f(x)=\log_2 (x-1)</p>
<p class= La première chose à faire est de trouver le domaine de la fonction. Et comme c'est un logarithme, son argument doit être supérieur à 0, puisqu'il n'existe ni logarithmes de nombres négatifs ni logarithme de 0. On regarde donc quand l'argument de

    \log_2 (x-1)

    est supérieur à 0 :

    x-1>0x>1

     Par conséquent, l'argument du logarithme sera positif si et seulement si

    X

    est supérieur à 1. Le domaine de la fonction est donc composé de tous les nombres supérieurs à 1 (non inclus) :

    \text{Dom } f = (1,+\infty)

     Une fois que nous connaissons le domaine de la fonction logarithmique, nous créons un tableau de valeurs. Évidemment, plus il y a de points calculés, plus la représentation de la fonction sera précise. Mais calculer environ 5 points dans l'intervalle du domaine suffit : 

<div class="wp-block-columns is-layout-flex wp-container-171">
<div class="wp-block-column is-layout-flow" style="flex-basis:66.66%">
<ul>
<li>“ title=“Rendered by QuickLaTeX.com“ height=“83″ width=“1969″ style=“vertical-align: 0px;“></p>
<p> x= 1.5 \ longrightarrow \ f(1.5)=\log_2 (1.5-1)=-1</p>
<p class=</li>
</ul>
<ul>
<li>“ title=“Rendered by QuickLaTeX.com“ height=“19″ width=“221″ style=“vertical-align: -5px;“></p>
<p> x= 2 \ longrightarrow \ f(2)=\log_2 (2-1)= 0</p>
<p class=</li>
</ul>
<ul>
<li>“ title=“Rendered by QuickLaTeX.com“ height=“19″ width=“221″ style=“vertical-align: -5px;“></p>
<p> x= 3 \ longrightarrow \ f(3)=\log_2 (3-1) = 1</p>
<p class=</li>
</ul>
<ul>
<li>“ title=“Rendered by QuickLaTeX.com“ height=“19″ width=“221″ style=“vertical-align: -5px;“></p>
<p> x= 5 \ longrightarrow \ f(5)=\log_2 (5-1) = 2</p>
<p class=</li>
</ul>
<ul>
<li>“ title=“Rendered by QuickLaTeX.com“ height=“19″ width=“221″ style=“vertical-align: -5px;“></p>
<p> x= 9 \ longrightarrow \ f(9)=\log_2 (9-1) = 3</p>
<p class=</li>
</ul>
</div>
<div class="wp-block-column is-vertically-aligned-center is-layout-flow" style="flex-basis:33.33%">“ title=“Rendered by QuickLaTeX.com“ height=“40″ width=“582″ style=“vertical-align: -4px;“></p>
<p> \begin{array}{c|c} x & f(x) \\ \hline 1,5 & -1 \\ 2 & 0 \\ 3 & 1 \\ 5 & 2 \\ 9 & 3 \end{array }</p>
<p class=</div>
</div>
<p> Nous vous recommandons d’utiliser une calculatrice pour trouver les points dans le tableau des valeurs, car ils ne sont pas faciles à calculer à la main. Cependant, dans certaines calculatrices, seuls les logarithmes en base 10 peuvent être calculés, auquel cas n’oubliez pas que vous pouvez trouver le résultat de n’importe quel logarithme en appliquant le changement de propriété de base des logarithmes :“ title=“Rendered by QuickLaTeX.com“ height=“19″ width=“3068″ style=“vertical-align: -5px;“></p>
<p> \log_2 0,5 = \cfrac{ \log 0,5 }{ \log 2} = -1</p>
<p class= Nous représentons maintenant les points obtenus sur un graphique <strong>:</strong> </p>
<div class="wp-block-image">
<figure class="aligncenter size-large is-resized"><img decoding="async" loading="lazy" src="http://mathority.org/wp-content/uploads/2023/07/comment-representer-ou-graphiquer-une-fonction-logarithmique.webp" alt="" class="wp-image-258" width="370" height="337" srcset="" sizes="" data-src=""></figure>
</div>
<p> Et enfin, nous joignons les points et allongeons la fonction : </p>
<div class="wp-block-image">
<figure class="aligncenter size-large is-resized"><img decoding="async" loading="lazy" src="http://mathority.org/wp-content/uploads/2023/07/exemple-de-representation-graphique-d-une-fonction-logarithmique.webp" alt="exemple de représentation graphique d'une fonction logarithmique" class="wp-image-259" width="370" height="339" srcset="" sizes="" data-src=""></figure>
</div>
<p> Notez que la fonction de droite continue de croître jusqu’à l’infini. En revanche, la fonction de gauche diminue mais n’atteint jamais x=1. Même s’il s’en rapproche beaucoup, il ne le touche jamais. Cela signifie que la droite x=1 est une asymptote verticale de la fonction. </p>
<h2 class="wp-block-heading"><span class="ez-toc-section" id="ejercicios-resueltos-de-funciones-logaritmica"></span> Exercices résolus sur les fonctions logarithmiques<span class="ez-toc-section-end"></span></h2>
<h3 class="wp-block-heading"> Exercice 1</h3>
<p> Calculez le domaine de la fonction logarithmique suivante : “ title=“Rendered by QuickLaTeX.com“ height=“347″ width=“4961″ style=“vertical-align: -5px;“></p>
<p> f(x)= \log_8 4x</p>
<p class=

<div class="wp-block-otfm-box-spoiler-start otfm-sp__wrapper otfm-sp__box js-otfm-sp-box__closed otfm-sp__E6F9EF" role="button" tabindex="0" aria-expanded="false" data-otfm-spc="#E6F9EF" style="text-align:center">
<div class="otfm-sp__title"> <strong>Voir la solution</strong></div>
</div>
<p> Il n’existe ni le logarithme d’un nombre négatif ni le logarithme de 0. Il faut donc regarder quand l’argument du logarithme est supérieur à 0 : “ title=“Rendered by QuickLaTeX.com“ height=“54″ width=“2128″ style=“vertical-align: -20px;“></p>
<p> 4x>0 x>\cfrac{0}{4} x>0 \mathbf{Dom } \ \bm{f = (0,+\infty)}</p>
<p class=

<div class="wp-block-otfm-box-spoiler-end otfm-sp_end"></div>
<h3 class="wp-block-heading"> Exercice 2</h3>
<p> Trouvez le domaine de la fonction logarithmique suivante : “ title=“Rendered by QuickLaTeX.com“ height=“60″ width=“582″ style=“vertical-align: -4px;“></p>
<p> f(x)= \log (4-x)</p>
<p class=

<div class="wp-block-otfm-box-spoiler-start otfm-sp__wrapper otfm-sp__box js-otfm-sp-box__closed otfm-sp__E6F9EF" role="button" tabindex="0" aria-expanded="false" data-otfm-spc="#E6F9EF" style="text-align:center">
<div class="otfm-sp__title"> <strong>Voir la solution</strong></div>
</div>
<p> Il n’existe ni le logarithme d’un nombre négatif ni le logarithme de 0. Il faut donc regarder quand l’argument du logarithme est supérieur à zéro : “ title=“Rendered by QuickLaTeX.com“ height=“54″ width=“2145″ style=“vertical-align: -20px;“></p>
<p> 4-x>0-x>-4x<\cfrac{-4}{-1} = 4</p>
<p class= N'oubliez pas que si dans une inégalité nous changeons les côtés d'un nombre négatif qui se multiplie ou se divise, nous devons également faire pivoter le signe de l'inégalité.

    x<4 \mathbf{Dom } \ \bm{f = (-\infty,4)}


<div class="wp-block-otfm-box-spoiler-end otfm-sp_end"></div>
<h3 class="wp-block-heading"> Exercice 3</h3>
<p> Représentez la fonction logarithmique suivante sur un graphique : “ title=“Rendered by QuickLaTeX.com“ height=“60″ width=“582″ style=“vertical-align: -4px;“></p>
<p> f(x)= \log_2 x</p>
<p class=

<div class="wp-block-otfm-box-spoiler-start otfm-sp__wrapper otfm-sp__box js-otfm-sp-box__closed otfm-sp__E6F9EF" role="button" tabindex="0" aria-expanded="false" data-otfm-spc="#E6F9EF" style="text-align:center">
<div class="otfm-sp__title"> <strong>Voir la solution</strong></div>
</div>
<p> Tout d’abord, il faut calculer le domaine de la fonction logarithmique : “ title=“Rendered by QuickLaTeX.com“ height=“54″ width=“1771″ style=“vertical-align: -20px;“></p>
<p> x>0 \text{Dom } f = (0,+\infty)</p>
<p class= Nous créons maintenant un tableau de valeurs en donnant des valeurs à <em>x</em> dans l’intervalle du domaine : </p>
<div class="wp-block-columns is-layout-flex wp-container-174">
<div class="wp-block-column is-layout-flow" style="flex-basis:66.66%">“ title=“Rendered by QuickLaTeX.com“ height=“82″ width=“582″ style=“vertical-align: -4px;“></p>
<p> x= 0,5 \ \longrightarrow \ f(0,5)= \log_2 0,5= -1 x= 1 \ \longrightarrow \ f(1)= \log_2 1= 0 x= 2 \ \longrightarrow \ f( 2)= \log_2 2 = 1 x= 4 \ \longrightarrow \ f(4)= \log_2 4= 2 x= 8 \ \longrightarrow \ f(8)= \log_2 8= 3</p>
<p class=</div>
<div class="wp-block-column is-vertically-aligned-center is-layout-flow" style="flex-basis:33.33%">“ title=“Rendered by QuickLaTeX.com“ height=“40″ width=“582″ style=“vertical-align: -4px;“></p>
<p> \begin{array}{c|c} x & f(x) \\ \hline 0,5 & -1 \\ 1 & 0 \\ 2 & 1 \\ 4 & 2 \\ 8 & 3 \end{array }</p>
<p class=</div>
</div>
<p> Enfin, nous représentons les points sur le graphique et dessinons la fonction : </p>
<div class="wp-block-image">
<figure class="aligncenter size-large is-resized"><img decoding="async" loading="lazy" src="http://mathority.org/wp-content/uploads/2023/07/polynomes-p-icone.png" alt="exercices résolus de fonctions logarithmiques" class="wp-image-260" width="375" height="313" srcset="" sizes="" data-src=""></figure>
</div>
<p> Notez que la fonction de droite continue de croître jusqu’à l’infini. Par contre, à gauche la fonction diminue mais ne croise jamais x=0. C’est parce que la fonction a une asymptote verticale sur l’axe Y. </p>
<div class="wp-block-otfm-box-spoiler-end otfm-sp_end"></div>
<h3 class="wp-block-heading"> Exercice 4</h3>
<p> Représentez graphiquement la fonction logarithmique suivante : “ title=“Rendered by QuickLaTeX.com“ height=“173″ width=“3070″ style=“vertical-align: -5px;“></p>
<p> f(x)= \log_2 (x+2)</p>
<p class=

<div class="wp-block-otfm-box-spoiler-start otfm-sp__wrapper otfm-sp__box js-otfm-sp-box__closed otfm-sp__E6F9EF" role="button" tabindex="0" aria-expanded="false" data-otfm-spc="#E6F9EF" style="text-align:center">
<div class="otfm-sp__title"> <strong>Voir la solution</strong></div>
</div>
<p> La première chose à faire est de calculer le domaine de la fonction logarithmique : “ title=“Rendered by QuickLaTeX.com“ height=“53″ width=“1825″ style=“vertical-align: -19px;“></p>
<p> x+2>0 x>-2 \text{Dom } f = (-2,+\infty)</p>
<p class= Nous créons maintenant une table de valeurs donnant des valeurs à <em>x</em> dans l’intervalle de domaine : </p>
<div class="wp-block-columns is-layout-flex wp-container-177">
<div class="wp-block-column is-layout-flow" style="flex-basis:66.66%">“ title=“Rendered by QuickLaTeX.com“ height=“82″ width=“582″ style=“vertical-align: -4px;“></p>
<p> x= -1.5 \ \longrightarrow \ f(-1.5)= \log_2 (-1.5+2)= -1 x= -1 \ \longrightarrow \ f(-1)= \log_2 (-1 +2)=0 x = 0 \ \longrightarrow \ f(0)=\log_2 (0+2)=1 x= 2 \ \longrightarrow \ f(2)=\log_2 (2+2)=2 x= 6 \ \longrightarrow \ f( 6)=\log_2 (6+2)=3</p>
<p class=</div>
<div class="wp-block-column is-vertically-aligned-center is-layout-flow" style="flex-basis:33.33%">“ title=“Rendered by QuickLaTeX.com“ height=“40″ width=“582″ style=“vertical-align: -4px;“></p>
<p> \begin{array}{c|c} x & f(x) \\ \hline -1,5 & -1 \\ -1 & 0 \\ 0 & 1 \\ 2 & 2 \\ 6 & 3 \end {array }</p>
<p class=</div>
</div>
<p> Enfin, nous traçons les points sur le graphique et traçons la fonction : </p>
<div class="wp-block-image">
<figure class="aligncenter size-large is-resized"><img decoding="async" loading="lazy" src="http://mathority.org/wp-content/uploads/2023/07/cropped-polynomials-p-icon.png.png" alt="exercice résolu étape par étape de la fonction logarithmique" class="wp-image-261" width="356" height="322" srcset="" sizes="" data-src=""></figure>
</div>
<p> Notez que la fonction de droite continue de croître jusqu’à l’infini. Par contre, à gauche la fonction diminue mais ne croise jamais x=-2. C’est parce qu’il a une asymptote verticale à x=-2. </p>
<div class="wp-block-otfm-box-spoiler-end otfm-sp_end"></div>
<h3 class="wp-block-heading"> Exercice 5</h3>
<p> Faites la représentation graphique de la fonction logarithmique suivante : “ title=“Rendered by QuickLaTeX.com“ height=“195″ width=“3059″ style=“vertical-align: -5px;“></p>
<p> f(x)=\log_3 x</p>
<p class=

<div class="wp-block-otfm-box-spoiler-start otfm-sp__wrapper otfm-sp__box js-otfm-sp-box__closed otfm-sp__E6F9EF" role="button" tabindex="0" aria-expanded="false" data-otfm-spc="#E6F9EF" style="text-align:center">
<div class="otfm-sp__title"> <strong>Voir la solution</strong></div>
</div>
<p> La première chose à faire est de calculer le domaine de la fonction logarithmique : “ title=“Rendered by QuickLaTeX.com“ height=“53″ width=“1825″ style=“vertical-align: -19px;“></p>
<p> x>0 \text{Dom } f = (0,+\infty)</p>
<p class= Nous créons maintenant un tableau de valeurs évaluant la fonction à différents points de l'intervalle de domaine : 

<div class="wp-block-columns is-layout-flex wp-container-180">
<div class="wp-block-column is-layout-flow" style="flex-basis:66.66%">“ title=“Rendered by QuickLaTeX.com“ height=“80″ width=“855″ style=“vertical-align: 0px;“></p>
<p> x= 1 \ \longrightarrow \ f (1)= \log_3 1= 0 x= 3 \ \longrightarrow \ f(3)= \log_3 3= 1 x= 9 \ \longrightarrow \ f(9)= \log_3 9= 2 \displaystyle x= \cfrac{1}{3} \ \longrightarrow \ f\left( \frac{1}{3} \right)= \log_3 \frac{1}{3}= -1 \displaystyle x= \cfrac{1}{9} \ \longrightarrow \ f\left( \frac{1}{9} \right)= \log_3 \frac{1}{9}= -2</p>
<p class=</div>
<div class="wp-block-column is-vertically-aligned-center is-layout-flow" style="flex-basis:33.33%">“ title=“Rendered by QuickLaTeX.com“ height=“40″ width=“582″ style=“vertical-align: -4px;“></p>
<p> \begin{array}{c|c} x & f(x) \\ \hline 1 & 0 \\ 3 & 1 \\ 9 & 2 \\ \frac{1}{3} & -1 \\[1.1 ex] \frac{1}{9} & -2 \end{array}</p>
<p class=</div>
</div>
<p> Et pour finir, nous représentons les points sur le graphique et peignons la fonction : </p>
<div class="wp-block-image">
<figure class="aligncenter size-large is-resized"><img decoding="async" loading="lazy" src="http://mathority.org/wp-content/uploads/2023/07/exemples-de-fonctions-logarithmiques-ou-avec-logarithmes.webp" alt="exemples de fonctions logarithmiques ou avec logarithmes" class="wp-image-262" width="438" height="321" srcset="" sizes="" data-src=""></figure>
</div>
<p> Notez que la fonction de droite continue de croître jusqu’à l’infini. Mais à gauche la fonction décroît bien qu’elle ne croise jamais x=0. C’est parce que la fonction a une asymptote verticale sur l’axe des ordonnées. </p>
<div class="wp-block-otfm-box-spoiler-end otfm-sp_end"></div>
<h3 class="wp-block-heading"> Exercice 6</h3>
<p> Représentez graphiquement la fonction suivante avec un logarithme : “ title=“Rendered by QuickLaTeX.com“ height=“195″ width=“3181″ style=“vertical-align: -5px;“></p>
<p> f(x)= \log_2 (1-x)</p>
<p class=

<div class="wp-block-otfm-box-spoiler-start otfm-sp__wrapper otfm-sp__box js-otfm-sp-box__closed otfm-sp__E6F9EF" role="button" tabindex="0" aria-expanded="false" data-otfm-spc="#E6F9EF" style="text-align:center">
<div class="otfm-sp__title"> <strong>Voir la solution</strong></div>
</div>
<p> Avant de représenter graphiquement la fonction, il faut calculer son domaine : “ title=“Rendered by QuickLaTeX.com“ height=“53″ width=“1817″ style=“vertical-align: -19px;“></p>
<p> 1-x>0-x>-1x<\cfrac{-1}{-1} = 1</p>
<p class= N'oubliez pas que si dans une inégalité nous changeons les côtés d'un nombre négatif qui multiplie ou divise, nous devons également inverser le signe de l'inégalité.

    x<1 \text{Dom } f = (-\infty,1)

     Nous créons maintenant une table de valeurs donnant des valeurs à <em>x</em> dans l’intervalle de domaine : </p>
<div class="wp-block-columns is-layout-flex wp-container-183">
<div class="wp-block-column is-layout-flow" style="flex-basis:66.66%">“ title=“Rendered by QuickLaTeX.com“ height=“82″ width=“582″ style=“vertical-align: -4px;“></p>
<p> x= 0,5 \ \longrightarrow \ f(0,5)= \log_2 (1-0,5)=-1 x= 0 \ \longrightarrow \ f(0)= \log_2 (1-0)= 0 x = -1 \ \longrightarrow \ f(-1)=\log_2 (1-(-1))=1 x= -3 \ \longrightarrow \ f(-3)=\log_2 (1-(-3))= 2 x= -7 \ \longrightarrow \ f(-7)=\log_2 (1-(-7))=3</p>
<p class=</div>
<div class="wp-block-column is-vertically-aligned-center is-layout-flow" style="flex-basis:33.33%">“ title=“Rendered by QuickLaTeX.com“ height=“40″ width=“582″ style=“vertical-align: -4px;“></p>
<p> \begin{array}{c|c} x & f(x) \\ \hline 0,5 & -1 \\ 0 & 0 \\ -1 & 1 \\ -3 & 2 \\ -7 & 3 \ end{ Array}</p>
<p class=</div>
</div>
<p> Et pour finir, nous représentons les points sur le graphique et traçons la fonction : </p>
<div class="wp-block-image">
<figure class="aligncenter size-large is-resized"><img decoding="async" loading="lazy" src="http://mathority.org/wp-content/uploads/2023/07/domaine-de-fonction-logarithmique.webp" alt="fonction de domaine logarithmique" class="wp-image-263" width="395" height="284" srcset="" sizes="" data-src=""></figure>
</div>
<p> Notez que la fonction de gauche continue de croître jusqu’à l’infini. Par contre, à droite la fonction diminue mais ne croise jamais x=1. Par conséquent, il a une asymptote verticale sur la droite x=1. </p>
<div class="wp-block-otfm-box-spoiler-end otfm-sp_end"></div>
<h2 class="wp-block-heading"><span class="ez-toc-section" id="propiedades-de-los-logaritmos"></span>Propriétés des logarithmes<span class="ez-toc-section-end"></span></h2>
<p> À titre récapitulatif, vous trouverez ci-dessous les propriétés des logarithmes au cas où vous auriez besoin d’effectuer des opérations avec des fonctions logarithmiques :</p>
<ul>
<li> Le logarithme d’un produit équivaut à la somme des logarithmes des facteurs.</li>
</ul>
<p>“ title=“Rendered by QuickLaTeX.com“ height=“195″ width=“5919″ style=“vertical-align: -5px;“></p>
<p> \log(A\cdot B) = \log A + \log B</p>
<p class=

<ul>
<li> Le logarithme d’un quotient est égal à la différence du logarithme du dividende moins le logarithme du diviseur.</li>
</ul>
<p>“ title=“Rendered by QuickLaTeX.com“ height=“41″ width=“943″ style=“vertical-align: -5px;“></p>
<p> \displaystyle \log \left(\frac{A}{B} \right) = \log A – \log B</p>
<p class=

<ul>
<li> Le logarithme d’une puissance revient à multiplier l’exposant de la puissance par le logarithme de la base.</li>
</ul>
<p>“ title=“Rendered by QuickLaTeX.com“ height=“41″ width=“892″ style=“vertical-align: -5px;“></p>
<p> \displaystyle \log A^n = n\cdot \log A</p>
<p class=

<ul>
<li> Le logarithme d’une racine équivaut à diviser le logarithme du radind par l’indice de la racine.</li>
</ul>
<p>“ title=“Rendered by QuickLaTeX.com“ height=“41″ width=“807″ style=“vertical-align: -5px;“></p>
<p> \displaystyle \log \sqrt[n]{A} =\cfrac{\log A}{n} $</li>
</ul>


			</div><!-- .entry-content .clear -->
</div>

	
</article><!-- #post-## -->


	        <nav class= Beitrags-Navigation

    Kommentar verfassen

    Deine E-Mail-Adresse wird nicht veröffentlicht. Erforderliche Felder sind mit * markiert

Nach oben scrollen