الدوال اللوغاريتمية

في هذه الصفحة سوف تكتشف ما هي الدوال اللوغاريتمية وأيضا كيفية تمثيلها على الرسم البياني. بالإضافة إلى ذلك، ستشاهد جميع خصائصه وكيفية حساب نطاقه والعديد من الأمثلة لفهمه بشكل أفضل. وأخيرا، سوف تكون قادرا على التدرب على حل التمارين والمسائل خطوة بخطوة على الدوال اللوغاريتمية.

ما هي الدالة اللوغاريتمية؟

تعريف الدالة اللوغاريتمية هو كما يلي:

في الرياضيات، الدوال اللوغاريتمية هي دالات يكون متغيرها المستقل x جزءًا من وسيطة اللوغاريتم. وبعبارة أخرى فهي كما يلي:

f(x)=\log_a x

ذهب

a

وهو بالضرورة رقم حقيقي موجب ويختلف عن 1.

على سبيل المثال، الدالة التالية لوغاريتمية:

f(x)=\log_5 x

قبل مناقشة خصائص الدوال اللوغاريتمية، دعونا نراجع بإيجاز مفهوم اللوغاريتم:

  • اللوغاريتم الأساسي

    a

    ل

    y

    هو العنصر الذي ينبغي رفع الرقم إليه

    a

    بحيث تكون النتيجة الرقم

    y.

\log_a y = x \iff a^x = y

ولنتذكر أيضًا أن اللوغاريتم الطبيعي (أو اللوغاريتم الطبيعي) يعادل اللوغاريتم الذي أساسه العدد الأسي e:

\ln x = \log_e x

في المقابل، عادةً ما يتم حذف الأساس عندما يكون 10. تسمى هذه الأنواع من اللوغاريتمات باللوغاريتمات العشرية أو الخوارزميات الشائعة:

\log_{10} x = \log x

مجال الدالة اللوغاريتمية

يقبل اللوغاريتم الأرقام الموجبة فقط، وبالتالي فإن مجال الدالة اللوغاريتمية سيكون جميع الأرقام التي تحقق هذا الشرط.

على سبيل المثال، سوف نقوم بحساب مجال الدالة اللوغاريتمية التالية:

f(x)=\log_3 (2x-4)

يجب أن تكون وسيطة اللوغاريتم أكبر من 0، لأنه لا توجد لوغاريتمات للأرقام السالبة ولا لوغاريتمات 0. لذلك يجب أن ننظر إلى متى تكون وسيطة الدالة أكبر من الصفر:

2x-4>0″ title=”Rendered by QuickLaTeX.com” height=”14″ width=”82″ style=”vertical-align: -2px;”></p>
</p>
<p style= الآن نحل عدم المساواة:

2x>4″ title=”Rendered by QuickLaTeX.com” height=”14″ width=”52″ style=”vertical-align: -2px;”></p>
</p>
<p style=

x>\cfrac{4}{2}” title=”Rendered by QuickLaTeX.com” height=”38″ width=”45″ style=”vertical-align: -12px;”></p>
</p>
<p style=

x>2″ title=”Rendered by QuickLaTeX.com” height=”14″ width=”42″ style=”vertical-align: -2px;”></p>
</p>
<p style= إذن سعة اللوغاريتم ستكون أكبر من الصفر إذا

x

أكبر من 2. وبالتالي، فإن مجال الدالة يتكون من جميع الأرقام الأكبر من 2 (غير متضمنة):

\text{Dom } f = (2,+\infty)

خصائص الدوال اللوغاريتمية

  • كما رأينا، يتكون مجال الدالة اللوغاريتمية من جميع علامات x التي تجعل وسيطة اللوغاريتم موجبة.
  • مدى أو نطاق الدالة اللوغاريتمية كلها أرقام حقيقية.

\text{Im } f= \mathbb{R}

  • كل دالة لوغاريتمية هي دالة مستمرة وحقنية.
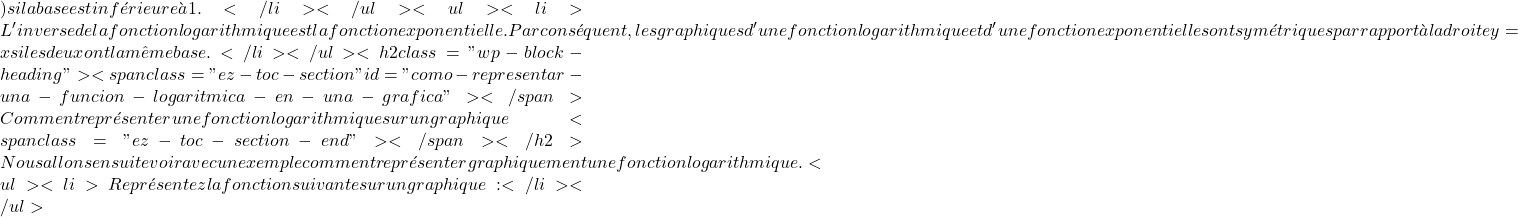
  • يعتمد نمو أو نقصان الدالة اللوغاريتمية على أساس اللوغاريتم: إذا كان الأساس أكبر من 1

    (a>1)” title=”Rendered by QuickLaTeX.com” height=”19″ width=”54″ style=”vertical-align: -5px;”></p>
<p> لكن الدالة تكون متزايدة إذا كان الأساس يقع في الفترة بين صفر وواحد.</p>
<p class=(0 la fonction est décroissante.</li>
</ul>
<ul>
<li> De même, la courbure de toute fonction logarithmique est également définie par sa base : la fonction sera concave (en forme” title=”Rendered by QuickLaTeX.com” height=”63″ width=”653″ style=”vertical-align: -5px;”></p>
<p> \بم{\كاب}</p>
<p class=) si la base est supérieure à 1, en revanche, elle sera convexe (sous forme de

    \بم{\كوب}

    ) si la base est inférieure à 1.</li>
</ul>
<ul>
<li> L’inverse de la fonction logarithmique est la fonction exponentielle. Par conséquent, les graphiques d’une fonction logarithmique et d’une fonction exponentielle sont symétriques par rapport à la droite y=x si les deux ont la même base. </li>
</ul>
<h2 class="wp-block-heading"><span class="ez-toc-section" id="como-representar-una-funcion-logaritmica-en-una-grafica"></span> Comment représenter une fonction logarithmique sur un graphique<span class="ez-toc-section-end"></span></h2>
<p> Nous allons ensuite voir avec un exemple comment représenter graphiquement une fonction logarithmique.</p>
<ul>
<li> Représentez la fonction suivante sur un graphique :</li>
</ul>
<p>” title=”Rendered by QuickLaTeX.com” height=”217″ width=”1518″ style=”vertical-align: -5px;”></p>
<p> و(س)=\log_2 (س-1)</p>
<p class= La première chose à faire est de trouver le domaine de la fonction. Et comme c'est un logarithme, son argument doit être supérieur à 0, puisqu'il n'existe ni logarithmes de nombres négatifs ni logarithme de 0. On regarde donc quand l'argument de

    \log_2 (س-1)

    est supérieur à 0 :

    س-1>0س>1

     Par conséquent, l'argument du logarithme sera positif si et seulement si

    س

    est supérieur à 1. Le domaine de la fonction est donc composé de tous les nombres supérieurs à 1 (non inclus) :

    \text{دوم} و = (1،+\infty)

     Une fois que nous connaissons le domaine de la fonction logarithmique, nous créons un tableau de valeurs. Évidemment, plus il y a de points calculés, plus la représentation de la fonction sera précise. Mais calculer environ 5 points dans l'intervalle du domaine suffit : 

<div class="wp-block-columns is-layout-flex wp-container-171">
<div class="wp-block-column is-layout-flow" style="flex-basis:66.66%">
<ul>
<li>” title=”Rendered by QuickLaTeX.com” height=”83″ width=”1969″ style=”vertical-align: 0px;”></p>
<p> x= 1.5 \ السهم الأيمن الطويل \ f(1.5)=\log_2 (1.5-1)=-1</p>
<p class=</li>
</ul>
<ul>
<li>” title=”Rendered by QuickLaTeX.com” height=”19″ width=”221″ style=”vertical-align: -5px;”></p>
<p> x= 2 \ السهم الأيمن الطويل \ f(2)=\log_2 (2-1)= 0</p>
<p class=</li>
</ul>
<ul>
<li>” title=”Rendered by QuickLaTeX.com” height=”19″ width=”221″ style=”vertical-align: -5px;”></p>
<p> x= 3 \ السهم الأيمن الطويل \ f(3)=\log_2 (3-1) = 1</p>
<p class=</li>
</ul>
<ul>
<li>” title=”Rendered by QuickLaTeX.com” height=”19″ width=”221″ style=”vertical-align: -5px;”></p>
<p> x= 5 \ السهم الأيمن الطويل \ f(5)=\log_2 (5-1) = 2</p>
<p class=</li>
</ul>
<ul>
<li>” title=”Rendered by QuickLaTeX.com” height=”19″ width=”221″ style=”vertical-align: -5px;”></p>
<p> x= 9 \ السهم الأيمن الطويل \ f(9)=\log_2 (9-1) = 3</p>
<p class=</li>
</ul>
</div>
<div class="wp-block-column is-vertically-aligned-center is-layout-flow" style="flex-basis:33.33%">” title=”Rendered by QuickLaTeX.com” height=”40″ width=”582″ style=”vertical-align: -4px;”></p>
<p> \begin{array}{c|c} x & f(x) \\ \hline 1,5 & -1 \\ 2 & 0 \\ 3 & 1 \\ 5 & 2 \\ 9 & 3 \end{array }</p>
<p class=</div>
</div>
<p> Nous vous recommandons d’utiliser une calculatrice pour trouver les points dans le tableau des valeurs, car ils ne sont pas faciles à calculer à la main. Cependant, dans certaines calculatrices, seuls les logarithmes en base 10 peuvent être calculés, auquel cas n’oubliez pas que vous pouvez trouver le résultat de n’importe quel logarithme en appliquant le changement de propriété de base des logarithmes :” title=”Rendered by QuickLaTeX.com” height=”19″ width=”3068″ style=”vertical-align: -5px;”></p>
<p> \log_2 0.5 = \cfrac{ \log 0.5 }{ \log 2} = -1</p>
<p class= Nous représentons maintenant les points obtenus sur un graphique <strong>:</strong> </p>
<div class="wp-block-image">
<figure class="aligncenter size-large is-resized"><img decoding="async" loading="lazy" src="http://mathority.org/wp-content/uploads/2023/07/comment-representer-ou-graphiquer-une-fonction-logarithmique.webp" alt="" class="wp-image-258" width="370" height="337" srcset="" sizes="" data-src=""></figure>
</div>
<p> Et enfin, nous joignons les points et allongeons la fonction : </p>
<div class="wp-block-image">
<figure class="aligncenter size-large is-resized"><img decoding="async" loading="lazy" src="http://mathority.org/wp-content/uploads/2023/07/exemple-de-representation-graphique-d-une-fonction-logarithmique.webp" alt="exemple de représentation graphique d'une fonction logarithmique" class="wp-image-259" width="370" height="339" srcset="" sizes="" data-src=""></figure>
</div>
<p> Notez que la fonction de droite continue de croître jusqu’à l’infini. En revanche, la fonction de gauche diminue mais n’atteint jamais x=1. Même s’il s’en rapproche beaucoup, il ne le touche jamais. Cela signifie que la droite x=1 est une asymptote verticale de la fonction. </p>
<h2 class="wp-block-heading"><span class="ez-toc-section" id="ejercicios-resueltos-de-funciones-logaritmica"></span> Exercices résolus sur les fonctions logarithmiques<span class="ez-toc-section-end"></span></h2>
<h3 class="wp-block-heading"> Exercice 1</h3>
<p> Calculez le domaine de la fonction logarithmique suivante : ” title=”Rendered by QuickLaTeX.com” height=”347″ width=”4961″ style=”vertical-align: -5px;”></p>
<p> و(س)= \log_8 4x</p>
<p class=

<div class="wp-block-otfm-box-spoiler-start otfm-sp__wrapper otfm-sp__box js-otfm-sp-box__closed otfm-sp__E6F9EF" role="button" tabindex="0" aria-expanded="false" data-otfm-spc="#E6F9EF" style="text-align:center">
<div class="otfm-sp__title"> <strong>Voir la solution</strong></div>
</div>
<p> Il n’existe ni le logarithme d’un nombre négatif ni le logarithme de 0. Il faut donc regarder quand l’argument du logarithme est supérieur à 0 : ” title=”Rendered by QuickLaTeX.com” height=”54″ width=”2128″ style=”vertical-align: -20px;”></p>
<p> 4x>0 x>\cfrac{0}{4} x>0 \mathbf{Dom } \ \bm{f = (0,+\infty)}</p>
<p class=

<div class="wp-block-otfm-box-spoiler-end otfm-sp_end"></div>
<h3 class="wp-block-heading"> Exercice 2</h3>
<p> Trouvez le domaine de la fonction logarithmique suivante : ” title=”Rendered by QuickLaTeX.com” height=”60″ width=”582″ style=”vertical-align: -4px;”></p>
<p> و(س)= \سجل (4-س)</p>
<p class=

<div class="wp-block-otfm-box-spoiler-start otfm-sp__wrapper otfm-sp__box js-otfm-sp-box__closed otfm-sp__E6F9EF" role="button" tabindex="0" aria-expanded="false" data-otfm-spc="#E6F9EF" style="text-align:center">
<div class="otfm-sp__title"> <strong>Voir la solution</strong></div>
</div>
<p> Il n’existe ni le logarithme d’un nombre négatif ni le logarithme de 0. Il faut donc regarder quand l’argument du logarithme est supérieur à zéro : ” title=”Rendered by QuickLaTeX.com” height=”54″ width=”2145″ style=”vertical-align: -20px;”></p>
<p> 4-x>0-x>-4x<\cfrac{-4}{-1} = 4</p>
<p class= N'oubliez pas que si dans une inégalité nous changeons les côtés d'un nombre négatif qui se multiplie ou se divise, nous devons également faire pivoter le signe de l'inégalité.

    x<4 \mathbf{Dom } \ \bm{f = (-\infty,4)}


<div class="wp-block-otfm-box-spoiler-end otfm-sp_end"></div>
<h3 class="wp-block-heading"> Exercice 3</h3>
<p> Représentez la fonction logarithmique suivante sur un graphique : ” title=”Rendered by QuickLaTeX.com” height=”60″ width=”582″ style=”vertical-align: -4px;”></p>
<p> و(س)= \log_2 س</p>
<p class=

<div class="wp-block-otfm-box-spoiler-start otfm-sp__wrapper otfm-sp__box js-otfm-sp-box__closed otfm-sp__E6F9EF" role="button" tabindex="0" aria-expanded="false" data-otfm-spc="#E6F9EF" style="text-align:center">
<div class="otfm-sp__title"> <strong>Voir la solution</strong></div>
</div>
<p> Tout d’abord, il faut calculer le domaine de la fonction logarithmique : ” title=”Rendered by QuickLaTeX.com” height=”54″ width=”1771″ style=”vertical-align: -20px;”></p>
<p> x>0 \text{Dom } f = (0,+\infty)</p>
<p class= Nous créons maintenant un tableau de valeurs en donnant des valeurs à <em>x</em> dans l’intervalle du domaine : </p>
<div class="wp-block-columns is-layout-flex wp-container-174">
<div class="wp-block-column is-layout-flow" style="flex-basis:66.66%">” title=”Rendered by QuickLaTeX.com” height=”82″ width=”582″ style=”vertical-align: -4px;”></p>
<p> x= 0.5 \ \longrightarrow \ f(0.5)= \log_2 0.5= -1 x= 1 \ \longrightarrow \ f(1)= \log_2 1= 0 x= 2 \ \longrightarrow \ f( 2)= \log_2 2 = 1 x= 4 \ \longrightarrow \ f(4)= \log_2 4= 2 x= 8 \ \longrightarrow \ f(8)= \log_2 8= 3</p>
<p class=</div>
<div class="wp-block-column is-vertically-aligned-center is-layout-flow" style="flex-basis:33.33%">” title=”Rendered by QuickLaTeX.com” height=”40″ width=”582″ style=”vertical-align: -4px;”></p>
<p> \begin{array}{c|c} x & f(x) \\ \hline 0.5 & -1 \\ 1 & 0 \\ 2 & 1 \\ 4 & 2 \\ 8 & 3 \end{array }</p>
<p class=</div>
</div>
<p> Enfin, nous représentons les points sur le graphique et dessinons la fonction : </p>
<div class="wp-block-image">
<figure class="aligncenter size-large is-resized"><img decoding="async" loading="lazy" src="http://mathority.org/wp-content/uploads/2023/07/polynomes-p-icone.png" alt="exercices résolus de fonctions logarithmiques" class="wp-image-260" width="375" height="313" srcset="" sizes="" data-src=""></figure>
</div>
<p> Notez que la fonction de droite continue de croître jusqu’à l’infini. Par contre, à gauche la fonction diminue mais ne croise jamais x=0. C’est parce que la fonction a une asymptote verticale sur l’axe Y. </p>
<div class="wp-block-otfm-box-spoiler-end otfm-sp_end"></div>
<h3 class="wp-block-heading"> Exercice 4</h3>
<p> Représentez graphiquement la fonction logarithmique suivante : ” title=”Rendered by QuickLaTeX.com” height=”173″ width=”3070″ style=”vertical-align: -5px;”></p>
<p> و(س)= \log_2 (س+2)</p>
<p class=

<div class="wp-block-otfm-box-spoiler-start otfm-sp__wrapper otfm-sp__box js-otfm-sp-box__closed otfm-sp__E6F9EF" role="button" tabindex="0" aria-expanded="false" data-otfm-spc="#E6F9EF" style="text-align:center">
<div class="otfm-sp__title"> <strong>Voir la solution</strong></div>
</div>
<p> La première chose à faire est de calculer le domaine de la fonction logarithmique : ” title=”Rendered by QuickLaTeX.com” height=”53″ width=”1825″ style=”vertical-align: -19px;”></p>
<p> x+2>0 x>-2 \text{Dom } f = (-2,+\infty)</p>
<p class= Nous créons maintenant une table de valeurs donnant des valeurs à <em>x</em> dans l’intervalle de domaine : </p>
<div class="wp-block-columns is-layout-flex wp-container-177">
<div class="wp-block-column is-layout-flow" style="flex-basis:66.66%">” title=”Rendered by QuickLaTeX.com” height=”82″ width=”582″ style=”vertical-align: -4px;”></p>
<p> x= -1.5 \ \longrightarrow \ f(-1.5)= \log_2 (-1.5+2)= -1 x= -1 \ \longrightarrow \ f(-1)= \log_2 (-1 +2)=0 x = 0 \ \longrightarrow \ f(0)=\log_2 (0+2)=1 x= 2 \ \longrightarrow \ f(2)=\log_2 (2+2)=2 x= 6 \ \longrightarrow \ f( 6)=\log_2 (6+2)=3</p>
<p class=</div>
<div class="wp-block-column is-vertically-aligned-center is-layout-flow" style="flex-basis:33.33%">” title=”Rendered by QuickLaTeX.com” height=”40″ width=”582″ style=”vertical-align: -4px;”></p>
<p> \begin{array}{c|c} x & f(x) \\ \hline -1.5 & -1 \\ -1 & 0 \\ 0 & 1 \\ 2 & 2 \\ 6 & 3 \end {array }</p>
<p class=</div>
</div>
<p> Enfin, nous traçons les points sur le graphique et traçons la fonction : </p>
<div class="wp-block-image">
<figure class="aligncenter size-large is-resized"><img decoding="async" loading="lazy" src="http://mathority.org/wp-content/uploads/2023/07/cropped-polynomials-p-icon.png.png" alt="exercice résolu étape par étape de la fonction logarithmique" class="wp-image-261" width="356" height="322" srcset="" sizes="" data-src=""></figure>
</div>
<p> Notez que la fonction de droite continue de croître jusqu’à l’infini. Par contre, à gauche la fonction diminue mais ne croise jamais x=-2. C’est parce qu’il a une asymptote verticale à x=-2. </p>
<div class="wp-block-otfm-box-spoiler-end otfm-sp_end"></div>
<h3 class="wp-block-heading"> Exercice 5</h3>
<p> Faites la représentation graphique de la fonction logarithmique suivante : ” title=”Rendered by QuickLaTeX.com” height=”195″ width=”3059″ style=”vertical-align: -5px;”></p>
<p> f(x)=\log_3 x</p>
<p class=

<div class="wp-block-otfm-box-spoiler-start otfm-sp__wrapper otfm-sp__box js-otfm-sp-box__closed otfm-sp__E6F9EF" role="button" tabindex="0" aria-expanded="false" data-otfm-spc="#E6F9EF" style="text-align:center">
<div class="otfm-sp__title"> <strong>Voir la solution</strong></div>
</div>
<p> La première chose à faire est de calculer le domaine de la fonction logarithmique : ” title=”Rendered by QuickLaTeX.com” height=”53″ width=”1825″ style=”vertical-align: -19px;”></p>
<p> x>0 \text{Dom } f = (0,+\infty)</p>
<p class= Nous créons maintenant un tableau de valeurs évaluant la fonction à différents points de l'intervalle de domaine : 

<div class="wp-block-columns is-layout-flex wp-container-180">
<div class="wp-block-column is-layout-flow" style="flex-basis:66.66%">” title=”Rendered by QuickLaTeX.com” height=”80″ width=”855″ style=”vertical-align: 0px;”></p>
<p> x= 1 \ \longrightarrow \ f (1)= \log_3 1= 0 x= 3 \ \longrightarrow \ f(3)= \log_3 3= 1 x= 9 \ \longrightarrow \ f(9)= \log_3 9= 2 \displaystyle x= \cfrac{1}{3} \ \longrightarrow \ f\left( \frac{1}{3} \right)= \log_3 \frac{1}{3}= -1 \displaystyle x= \cfrac{1}{9} \ \longrightarrow \ f\left( \frac{1}{9} \right)= \log_3 \frac{1}{9}= -2</p>
<p class=</div>
<div class="wp-block-column is-vertically-aligned-center is-layout-flow" style="flex-basis:33.33%">” title=”Rendered by QuickLaTeX.com” height=”40″ width=”582″ style=”vertical-align: -4px;”></p>
<p> \begin{array}{c|c} x & f(x) \\ \hline 1 & 0 \\ 3 & 1 \\ 9 & 2 \\ \frac{1}{3} & -1 \\[1.1 على سبيل المثال] \frac{1}{9} & -2 \end{array}</p>
<p class=</div>
</div>
<p> Et pour finir, nous représentons les points sur le graphique et peignons la fonction : </p>
<div class="wp-block-image">
<figure class="aligncenter size-large is-resized"><img decoding="async" loading="lazy" src="http://mathority.org/wp-content/uploads/2023/07/exemples-de-fonctions-logarithmiques-ou-avec-logarithmes.webp" alt="exemples de fonctions logarithmiques ou avec logarithmes" class="wp-image-262" width="438" height="321" srcset="" sizes="" data-src=""></figure>
</div>
<p> Notez que la fonction de droite continue de croître jusqu’à l’infini. Mais à gauche la fonction décroît bien qu’elle ne croise jamais x=0. C’est parce que la fonction a une asymptote verticale sur l’axe des ordonnées. </p>
<div class="wp-block-otfm-box-spoiler-end otfm-sp_end"></div>
<h3 class="wp-block-heading"> Exercice 6</h3>
<p> Représentez graphiquement la fonction suivante avec un logarithme : ” title=”Rendered by QuickLaTeX.com” height=”195″ width=”3181″ style=”vertical-align: -5px;”></p>
<p> و(س)= \log_2 (1-س)</p>
<p class=

<div class="wp-block-otfm-box-spoiler-start otfm-sp__wrapper otfm-sp__box js-otfm-sp-box__closed otfm-sp__E6F9EF" role="button" tabindex="0" aria-expanded="false" data-otfm-spc="#E6F9EF" style="text-align:center">
<div class="otfm-sp__title"> <strong>Voir la solution</strong></div>
</div>
<p> Avant de représenter graphiquement la fonction, il faut calculer son domaine : ” title=”Rendered by QuickLaTeX.com” height=”53″ width=”1817″ style=”vertical-align: -19px;”></p>
<p> 1-x>0-x>-1x<\cfrac{-1}{-1} = 1</p>
<p class= N'oubliez pas que si dans une inégalité nous changeons les côtés d'un nombre négatif qui multiplie ou divise, nous devons également inverser le signe de l'inégalité.

    x<1 \text{Dom } f = (-\infty,1)

     Nous créons maintenant une table de valeurs donnant des valeurs à <em>x</em> dans l’intervalle de domaine : </p>
<div class="wp-block-columns is-layout-flex wp-container-183">
<div class="wp-block-column is-layout-flow" style="flex-basis:66.66%">” title=”Rendered by QuickLaTeX.com” height=”82″ width=”582″ style=”vertical-align: -4px;”></p>
<p> x= 0.5 \ \longrightarrow \ f(0.5)= \log_2 (1-0.5)=-1 x= 0 \ \longrightarrow \ f(0)= \log_2 (1-0)= 0 x = -1 \ \longrightarrow \ f(-1)=\log_2 (1-(-1))=1 x= -3 \ \longrightarrow \ f(-3)=\log_2 (1-(-3))= 2 x= -7 \ \longrightarrow \ f(-7)=\log_2 (1-(-7))=3</p>
<p class=</div>
<div class="wp-block-column is-vertically-aligned-center is-layout-flow" style="flex-basis:33.33%">” title=”Rendered by QuickLaTeX.com” height=”40″ width=”582″ style=”vertical-align: -4px;”></p>
<p> \begin{array}{c|c} x & f(x) \\ \hline 0.5 & -1 \\ 0 & 0 \\ -1 & 1 \\ -3 & 2 \\ -7 & 3 \ end{ مجموعة مصفوفة}</p>
<p class=</div>
</div>
<p> Et pour finir, nous représentons les points sur le graphique et traçons la fonction : </p>
<div class="wp-block-image">
<figure class="aligncenter size-large is-resized"><img decoding="async" loading="lazy" src="http://mathority.org/wp-content/uploads/2023/07/domaine-de-fonction-logarithmique.webp" alt="fonction de domaine logarithmique" class="wp-image-263" width="395" height="284" srcset="" sizes="" data-src=""></figure>
</div>
<p> Notez que la fonction de gauche continue de croître jusqu’à l’infini. Par contre, à droite la fonction diminue mais ne croise jamais x=1. Par conséquent, il a une asymptote verticale sur la droite x=1. </p>
<div class="wp-block-otfm-box-spoiler-end otfm-sp_end"></div>
<h2 class="wp-block-heading"><span class="ez-toc-section" id="propiedades-de-los-logaritmos"></span>Propriétés des logarithmes<span class="ez-toc-section-end"></span></h2>
<p> À titre récapitulatif, vous trouverez ci-dessous les propriétés des logarithmes au cas où vous auriez besoin d’effectuer des opérations avec des fonctions logarithmiques :</p>
<ul>
<li> Le logarithme d’un produit équivaut à la somme des logarithmes des facteurs.</li>
</ul>
<p>” title=”Rendered by QuickLaTeX.com” height=”195″ width=”5919″ style=”vertical-align: -5px;”></p>
<p> \log(A\cdot B) = \log A + \log B</p>
<p class=

<ul>
<li> Le logarithme d’un quotient est égal à la différence du logarithme du dividende moins le logarithme du diviseur.</li>
</ul>
<p>” title=”Rendered by QuickLaTeX.com” height=”41″ width=”943″ style=”vertical-align: -5px;”></p>
<p> \displaystyle \log \left(\frac{A}{B} \right) = \log A – \log B</p>
<p class=

<ul>
<li> Le logarithme d’une puissance revient à multiplier l’exposant de la puissance par le logarithme de la base.</li>
</ul>
<p>” title=”Rendered by QuickLaTeX.com” height=”41″ width=”892″ style=”vertical-align: -5px;”></p>
<p> \displaystyle \log A^n = n\cdot \log A</p>
<p class=

<ul>
<li> Le logarithme d’une racine équivaut à diviser le logarithme du radind par l’indice de la racine.</li>
</ul>
<p>” title=”Rendered by QuickLaTeX.com” height=”41″ width=”807″ style=”vertical-align: -5px;”></p>
<p> \displaystyle \log \sqrt[n]{A} =\cfrac{\log A}{n} $</li>
</ul>


			</div><!-- .entry-content .clear -->
</div>

	
</article><!-- #post-## -->


	        <nav class= تصفّح المقالات

    اترك تعليقاً

    لن يتم نشر عنوان بريدك الإلكتروني. الحقول الإلزامية مشار إليها بـ *

Scroll to Top